5 Minute Explanation of Leveraged Investing

 Researchers tend to find that over long periods of time, investors drastically underperform markets.

Over a 20-year period that was analyzed, researchers found that the average investor earned only three point six percent annualized. Meanwhile, balanced funds ranged from 6 to 7% on average, and the stock market an annualized return of 9.5%.

 Over long periods of time, that leads to drastically different results. And I don’t think that that is the ceiling of what is actually possible.

I’m Charles Tines. I’m the founder of Tines Capital. I’m a former engineer turned asset manager,  and my goal is simple. Make your money work as hard as possible for you

 So why is there this big gap between what markets tend to offer and what investors actually get? One is investors often remain too conservative,  too heavily invested in cash, not willing to take risks in bonds or stocks. Two, when investors are willing to take risks, they often buy in and sell out based upon fear and emotions and try to time the market.

 Three, investors also tend to pay  way too much in fees for things that  they do not need,  such as managers that are trying to pick individual stocks.  So the classic advice of be patient, consistent, buy, hold, keep your costs low, these are fantastic pieces of advice that if you get nothing else out of this video, I hope you really take that to heart 

But what I use goes even further. Look at this three times leveraged fund of the S&P 500 compared to the regular S&P 500.

 It grew a massive amount more than the regular stock market.  This is a real fund that existed starting around 2010.  But unfortunately, most of these types of funds that add a three times daily multiplier did not begin to exist until after the 2008 financial crisis and other previous big crises. Since periods like that were never covered by these types of funds in real life,  that’s why I’ve recreated them in synthetic versions to simulate what something like that might have done in the past

 When we look at that on a log scale, we can really  see how risky these funds are and how important it is that if you’re gonna use them, you know what you’re doing. Because these funds, if they existed, likely would have had a 20 year timeframe of negative returns.  They would have had a drop of over ninety-five percent in value, which is not something that any reasonable investor is gonna be able to stick through because it is way too intense.  But all’s not lost, and I think these are still powerful tools.

I believe there are ways to capture most of the upside while reducing some of the negative effects that these funds have. These types of funds have a lot of risk because of the leverage that’s inherent to them, the leverage decay, but fortunately, they never require me, the investor, or you, the investor, to actually take out a loan to hold them. And I think we can improve the returns quite significantly by doing a few things. For example,  this is the same back-tested simulation,  but this time it actually has a 200 day average price filter,  meaning that it looks at what the current price of the fund is, it compares it to the average price for the last two hundred days,  and if it is below that price, then we’re gonna reduce our holding to just one-third the typical size.

Here’s another simulation where instead of doing just three times stocks, fifty percent is allocated to three times stocks, and fifty percent is allocated to three times bonds with regular rebalancing.  

But when you start taking these things and combining them together, I think you can make really powerful portfolios that mix well with your existing 401(k)’s, real estate holdings. And you can use these in retirement accounts such as Roth IRAs and traditional IRAs, which can help shield these from the huge tax drags that you might have otherwise.  

if you are interested in seeing how things like this may work for you, I encourage you to reach out to us at TinesCapital.com give us a like, subscribe, and share this video with somebody that you think might be interested.

Comprehensive Disclaimer: Tines Capital, LLC

Registration & Relationship Tines Capital, LLC (“TC”) is a registered investment adviser in the State of Oklahoma and in other jurisdictions where exempted. The information provided in this communication—including videos, articles, linked tools, and other materials—is strictly for educational and informational purposes. Viewing this content, submitting information, or using any linked tools (including RightCapital) does not create an advisory-client relationship with TC. An advisory relationship is established only after you and TC enter into a signed, written agreement.

Scope & Limitations This communication is not intended as personalized investment, tax, accounting, or legal advice, nor should it be relied upon as the sole basis for any financial decision. It does not constitute an offer, a solicitation to buy or sell, or an endorsement of any company, security, fund, or other offering in any jurisdiction where such an offer, solicitation, or recommendation would be unlawful. All views, expressions, estimates, and opinions constitute TC’s judgment as of the date of this communication and are subject to change without notice.

Risk & Performance Past performance is no indication or guarantee of future results. Investing in securities involves significant risk, including the potential for partial or complete loss of the principal funds invested. It should not be assumed that any recommendations made will be profitable or perform similarly to the hypothetical or historical performance noted in this publication.

Warranties, Liability, & Third Parties All information herein is provided “AS IS” and without warranties of any kind, either express or implied. To the fullest extent permissible by applicable law, TC disclaims all warranties, including but not limited to implied warranties of merchantability, non-infringement, and fitness for a particular purpose. TC does not warrant that the information will be free from error, nor does it guarantee its accuracy, timeliness, or completeness. Under no circumstances shall TC be liable for any direct, indirect, special, or consequential damages that result from the use of, or the inability to use, the information provided herein, even if TC has been advised of the possibility of such damages. Your use of this information is at your sole risk. Additionally, links to third-party sites or tools are provided for convenience only; TC does not control and is not responsible for the content, security, or privacy practices of these third parties.
Japanese Yen Carry Trade

I want to discuss some of my favorite ETFs, despite the losses they’ve brought me this year: SVIX, UVIX, and VXX. If you’re not a high-risk investment enthusiast, you may not have heard of these—they’re niche products. However, when used appropriately, I believe they offer a good opportunity for investors.

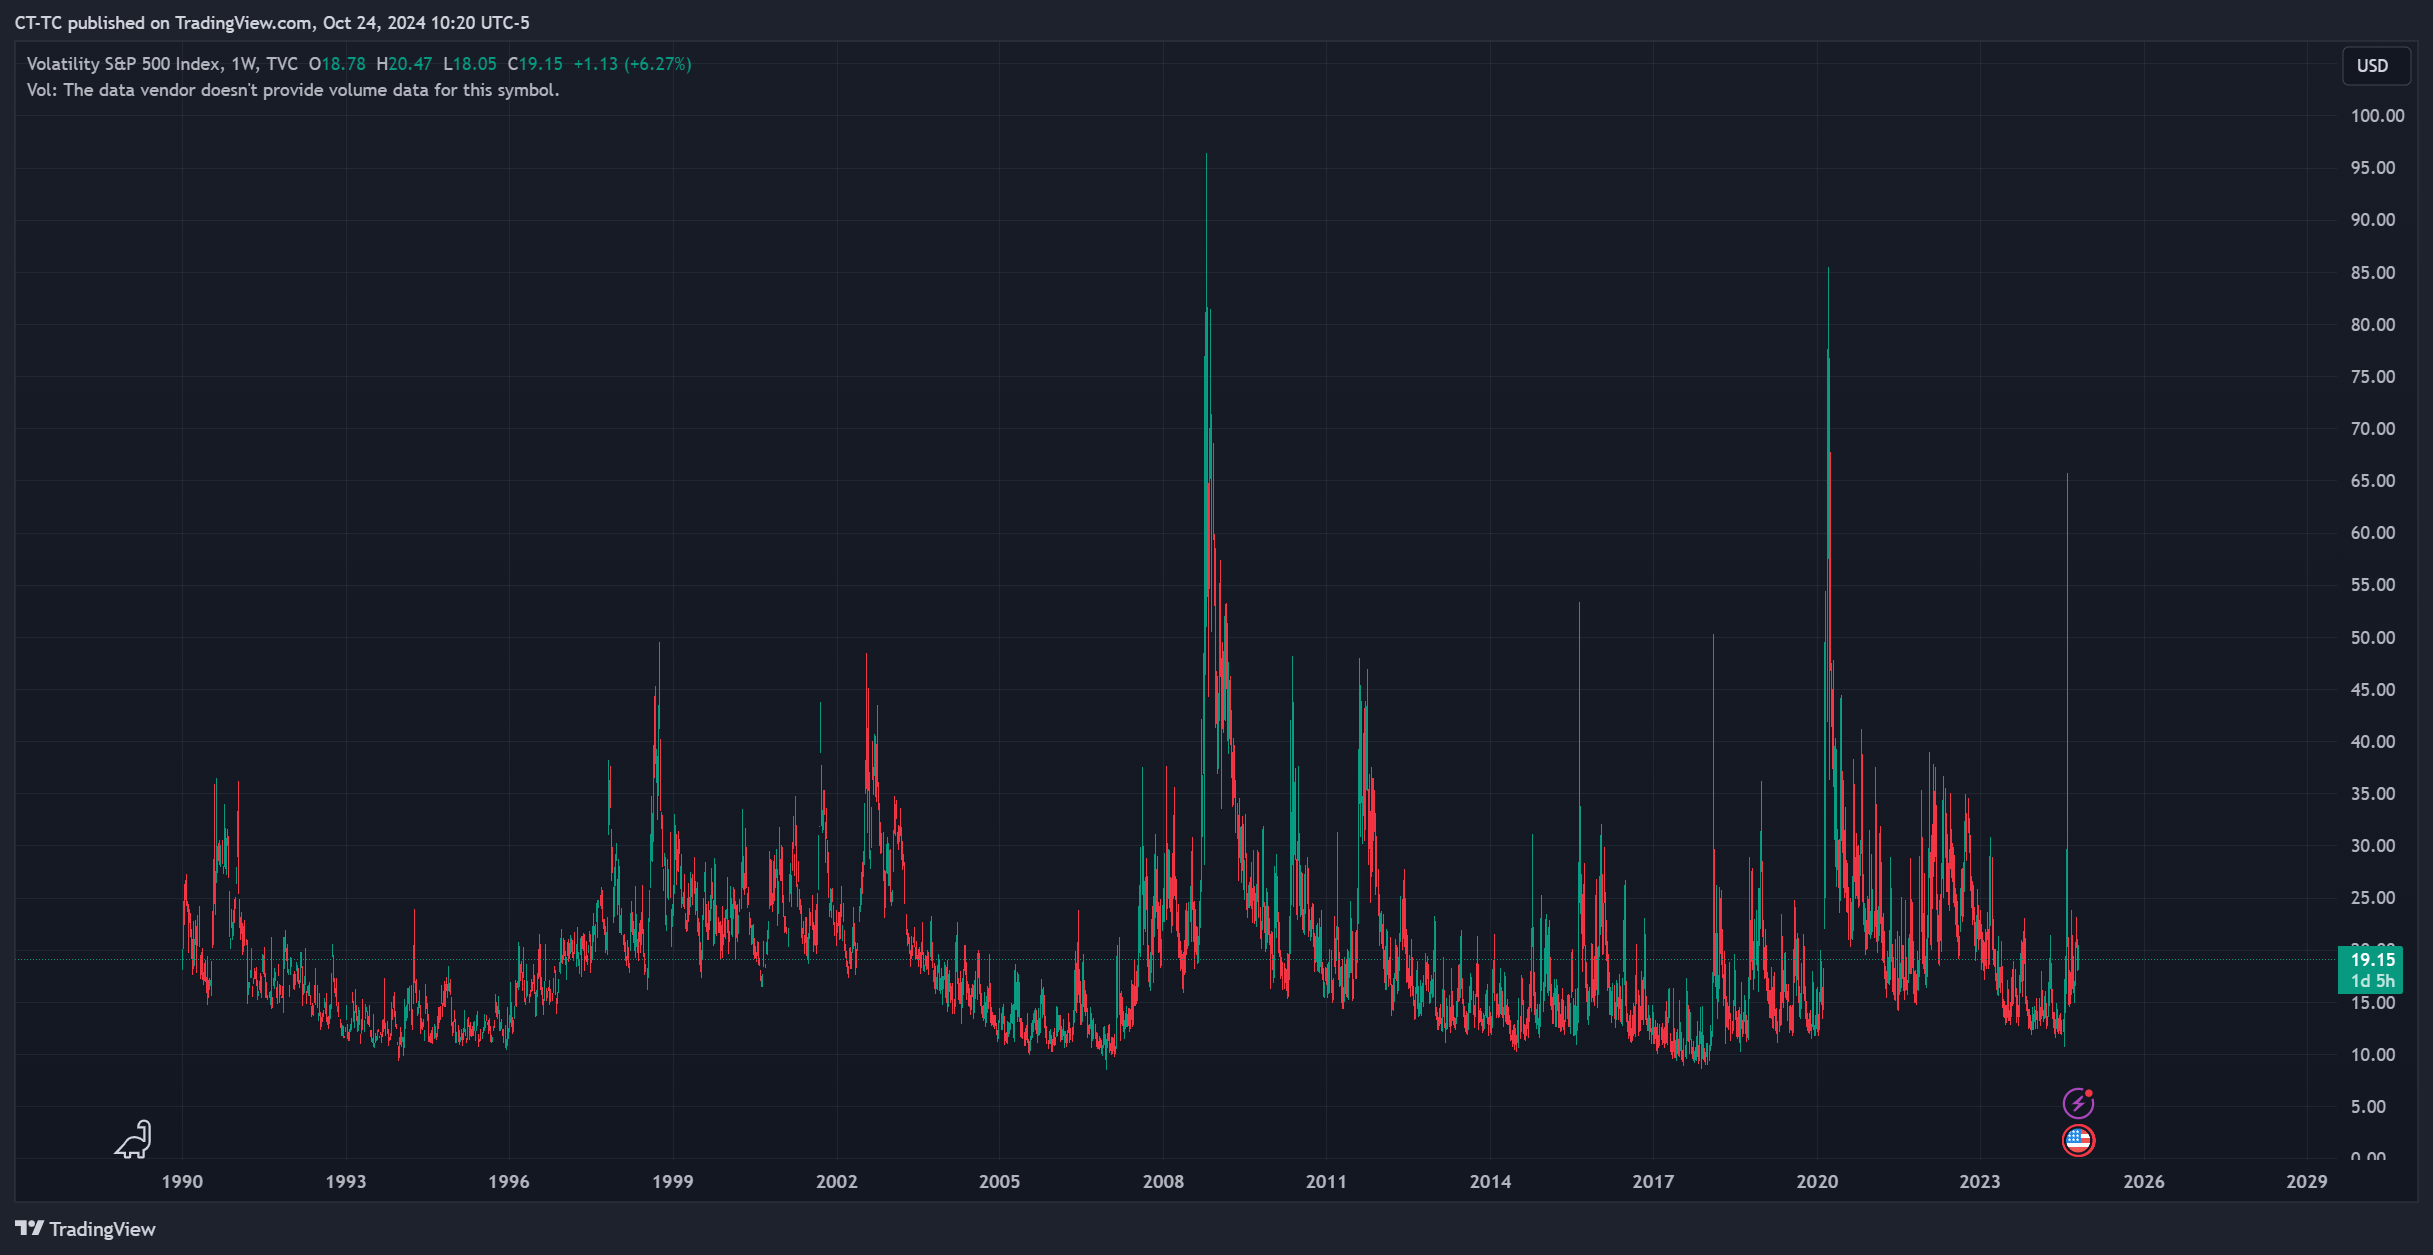
These ETFs don’t invest in stocks or bonds; instead, they buy or short VIX futures. The VIX, often referred to as the “fear gauge,” is a well-known market indicator that has been around since the 1990s. It measures how much investors expect the market to move in the next 30 days, based on the prices they’re willing to pay for options contracts on the S&P 500. When you graph the VIX from the 1990s to today, you’ll see large spikes, but it generally trends back toward the mean over time.

Investors can’t directly purchase the VIX, as it’s just a measurement. However, Wall Street has found ways to let you place a bet on almost anything, including the VIX. Investors can trade VIX futures contracts with various expirations over the next year. The ETFs I mentioned earlier—SVIX, UVIX, and VXX—buy and sell these VIX futures contracts, maintaining an average expiration of 30 days.

  • SVIX shorts (sells) VIX futures with a target of -1x exposure.
  • VXX goes long (buys) VIX futures with a target of 1x exposure.
  • UVIX goes long (buys) VIX futures with a target of 2x exposure.

VXX is the oldest VIX futures fund available, and it’s notorious for burning cash! Here’s a chart (both log and linear) showing its performance since 2009.

Ouch! Because of this, I almost never buy VXX or UVIX. It’s very rare for me to do so, and the only time I purchase them is when my algorithms see high chances of a significant and immediate market move. Timing this correctly is challenging, but when it works, it can help save a portfolio. Of course, it can also result in significant losses when it is wrong. Over the past five years, I’ve typically held VXX or UVIX for only about 1% of the time.

If VXX is so bad, then its inverse, SVIX, must be amazing, right? Well, yes and no. SVIX aims to track the SHORTVOL index, and since SVIX is relatively new, I’ll primarily use the SHORTVOL index as a proxy for SVIX in this discussion.

Below is a chart comparing the SHORTVOL index (green) to the SPX index (grey). Historically, SHORTVOL has delivered some monster returns! However, it also experiences some very steep and alarming drops in value. It’s not the kind of investment I could comfortably hold as a significant portion of my portfolio for the long term.

This year was one of those year where SVIX wasn’t so kind. As shown below it has done terrible.

Most of the time, I believe it’s much better to hold SVIX, but on rare occasions, it makes sense to buy VXX. Take the COVID-19 pandemic as an example. In February 2020, certain metrics I follow indicated that buying VXX was more favorable than SVIX. VXX went on to climb about 300% in the following months. That was definitely not a time to be holding SVIX, and my signals performed exceptionally well during that period.

However, there are times when market panics are enough to trigger a VXX or UVIX purchase but quickly turn out to be minor events. This year provided a great example. In August, concerns arose around the Japanese Yen carry trade—something I hadn’t worried about before August 2024, and virtually no one else had either. Suddenly, it became a big concern, but just a few days later, more data emerged, and the markets calmed down quickly. If the Japanese Yen carry scare had evolved into a major crisis, like the 2008 financial meltdown or the pandemic, the SVIX and VXX trades could have performed very well this year. However, it’s challenging for my VIX strategies to succeed when panics are extreme, brief, and ultimately inconsequential.

Trading SVIX, VXX, and UVIX is best left to professionals. I wouldn’t recommend that most people buy and sell these products on their own. Despite this subset of algorithm’s poor performance this year, there are still enough great years—like 2020,2021, and 2023—that make them worth keeping in my high-risk algorithms.

Comprehensive Disclaimer: Tines Capital, LLC

Registration & Relationship Tines Capital, LLC (“TC”) is a registered investment adviser in the State of Oklahoma and in other jurisdictions where exempted. The information provided in this communication—including videos, articles, linked tools, and other materials—is strictly for educational and informational purposes. Viewing this content, submitting information, or using any linked tools (including RightCapital) does not create an advisory-client relationship with TC. An advisory relationship is established only after you and TC enter into a signed, written agreement.

Scope & Limitations This communication is not intended as personalized investment, tax, accounting, or legal advice, nor should it be relied upon as the sole basis for any financial decision. It does not constitute an offer, a solicitation to buy or sell, or an endorsement of any company, security, fund, or other offering in any jurisdiction where such an offer, solicitation, or recommendation would be unlawful. All views, expressions, estimates, and opinions constitute TC’s judgment as of the date of this communication and are subject to change without notice.

Risk & Performance Past performance is no indication or guarantee of future results. Investing in securities involves significant risk, including the potential for partial or complete loss of the principal funds invested. It should not be assumed that any recommendations made will be profitable or perform similarly to the hypothetical or historical performance noted in this publication.

Warranties, Liability, & Third Parties All information herein is provided “AS IS” and without warranties of any kind, either express or implied. To the fullest extent permissible by applicable law, TC disclaims all warranties, including but not limited to implied warranties of merchantability, non-infringement, and fitness for a particular purpose. TC does not warrant that the information will be free from error, nor does it guarantee its accuracy, timeliness, or completeness. Under no circumstances shall TC be liable for any direct, indirect, special, or consequential damages that result from the use of, or the inability to use, the information provided herein, even if TC has been advised of the possibility of such damages. Your use of this information is at your sole risk. Additionally, links to third-party sites or tools are provided for convenience only; TC does not control and is not responsible for the content, security, or privacy practices of these third parties.

Investor Update August 2023

I hope this letter finds you well as the second quarter has now ended, I want to highlight a few important investment concepts that remain crucial to long-term success. Also, with higher interest rates I want to encourage you to make sure your shorter-term savings, emergency funds, and cash-like positions are getting good interest rates. If not, there are some good opportunities available to earn roughly 4-5% annualized on your savings. As always if you would like to discuss your investments, Tines Capital is only a call away.

2023 has been great for many of Tines Capital’s strategies. The most aggressive and largest strategy we offer was up rather dramatically in the first 6 months of 2023. Whether a strategy is up 50% or down 50% my advice is the same. Money that you need soon should be invested in something stable and conservative. Money you don’t need for many years should be invested in something with a higher potential return – which typically means more volatility.

Investment decisions should be based primarily on when you plan to spend the money, not on recent performance – good or bad. Ignoring recent performance is counterintuitive, but study after study shows investors that are patient & consistent tend to do better.

The chart below is from a study comparing the average investor return vs. several investment options over a 20-year period. The average investor (orange) had an annualized return of only 3.6%. That is terrible!

Investors did poorly because they tended to pile into an asset based on good recent performance then flee after a bad period. Likewise, investors tended to remain in cash anticipating crashes and often had to watch long bull runs take place mostly without them. The difference is even starker when you convert those annualized returns into overall growth as I have done below.

Ending Value for $10,000 Investment after 20 years.
Average Investor$20,000
40/60 Stock/Bond Fund$35,000
S&P 500 $61,000

I encourage investors to be patient, methodical, and mostly ignore recent performance – good or bad. This same advice applies whether you are investing in short-term treasury funds, stock index funds, or our algorithms. Investment decisions should be based primarily on when you plan to spend the money and your risk tolerance, not on recent performance – good or bad.

Interest rates are much higher than they have been in the last 10 years, but many banks aren’t going to automatically raise the interest rate you get on your savings. So, action may be needed. One to three month US treasury funds are yielding over 5% and can be purchased in most brokerage accounts including Interactive Brokers via Tines Capital. If you don’t feel comfortable purchasing them on your own and saving yourself the Tines Capital management fee, we are happy to help you do it!

Some local banks have savings rates that are paying as little as 0.25% (Arvest and BOK). One solution is to find other banks with better rates or shop for a certificate of deposit (CD) which are paying closer to the 4-5% range. These can be good since they lock in a rate but remember that you must make sure the lockup period on a CD works well for your situation.  

In the chart below the Federal Funds interest rate is shown in orange. When the Federal Funds rate goes up the cost of all debt tends to go up. This is great for savers since when you deposit money in a bank you are in a way loaning them money. Likewise, treasuries are essentially loans you give the US government that obligate the government to pay interest to you. They can also be bought and sold any day the market is open making them much more liquid than a CD.

The volatility in short-term treasury funds is extremely low as you can see by the smoothness of the blue line in the chart. For 2009-2017 and 2020-2021 the fund was slightly negative because interest rates were near zero and slightly below the management fee of the fund. If rates drop lower than the management fee it can become advantageous to sell treasury funds and convert to cash or another investment. Currently, short-term treasury funds are growing at a rate of about 5% – including dividends. If the Fed raises rates, we could see the growth steepen. If they drop rates, we could see the growth rate of these funds flatten. Either way if you have significant cash-like savings you should be trying to get around 4-5% in this current environment.

Now that the second quarter has ended you should be seeing quarterly statements in the mail in the coming weeks. If you do not receive your statement(s) please double check that you have the correct home and mailing address on file with interactivebrokers.com. If you would like any help, remember that you can always reach out to Tines Capital anytime for help or questions.

Comprehensive Disclaimer: Tines Capital, LLC

Registration & Relationship Tines Capital, LLC (“TC”) is a registered investment adviser in the State of Oklahoma and in other jurisdictions where exempted. The information provided in this communication—including videos, articles, linked tools, and other materials—is strictly for educational and informational purposes. Viewing this content, submitting information, or using any linked tools (including RightCapital) does not create an advisory-client relationship with TC. An advisory relationship is established only after you and TC enter into a signed, written agreement.

Scope & Limitations This communication is not intended as personalized investment, tax, accounting, or legal advice, nor should it be relied upon as the sole basis for any financial decision. It does not constitute an offer, a solicitation to buy or sell, or an endorsement of any company, security, fund, or other offering in any jurisdiction where such an offer, solicitation, or recommendation would be unlawful. All views, expressions, estimates, and opinions constitute TC’s judgment as of the date of this communication and are subject to change without notice.

Risk & Performance Past performance is no indication or guarantee of future results. Investing in securities involves significant risk, including the potential for partial or complete loss of the principal funds invested. It should not be assumed that any recommendations made will be profitable or perform similarly to the hypothetical or historical performance noted in this publication.

Warranties, Liability, & Third Parties All information herein is provided “AS IS” and without warranties of any kind, either express or implied. To the fullest extent permissible by applicable law, TC disclaims all warranties, including but not limited to implied warranties of merchantability, non-infringement, and fitness for a particular purpose. TC does not warrant that the information will be free from error, nor does it guarantee its accuracy, timeliness, or completeness. Under no circumstances shall TC be liable for any direct, indirect, special, or consequential damages that result from the use of, or the inability to use, the information provided herein, even if TC has been advised of the possibility of such damages. Your use of this information is at your sole risk. Additionally, links to third-party sites or tools are provided for convenience only; TC does not control and is not responsible for the content, security, or privacy practices of these third parties.